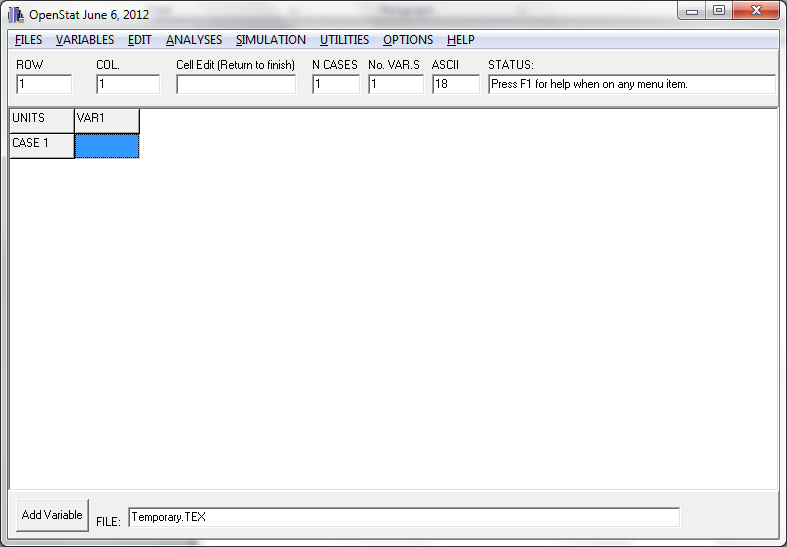
The above shows the data grid when the program has begun. Across the top are the main menues which, when clicked, drop down a list of sub-menues. Below that are some boxes which report the current grid row, column, number of cases, number of variables, the American Standard Code for Information Interchange (ASCII) for a character entered in a grid cell, and a status indicator. There is also a box for editing the contents of a previously entered cell value. Below the "grid" where data are entered is a button that when pressed adds another variable column (with a default type of floating point values.) There is also a box which indicates the current name of the file. This changes after the file has been saved.
A variety of options exist for saving and opening data files. The preferred method is to use the file extension .TEX which saves not only the data from the grid but also the definition of the variables in the grid. Tab files are useful for importing data from other programs (for example Excel files) or for exporting a file to another program.
The typical user, in creating a new data file, will select the "Define" option. This option lets the user specify the name of a variable (grid column), the type of data in the vaiable (floating point, integer, string, etc.), the number of decimal fractions, and a value representing a missing value. One can also sort the data in the grid in an ascending or descending order of one of the variables. Occassionally one will need to transform the values of a variable (for example into normally distributed values) or perform a mathematical transformation such a the log of the values. The user can also combine values of several variables to create a new variable or enter an equation to combine and transform multiple variables. If a file contains one variable of values and another variable containing the frequency count of values in the previous variable, one can construct a new file that contains each of the values in one column. Finally, a large file may be split into several files for different analyses or several files may be merged.
A typical user will often need to insert a new row or column in the data grid, delete a row or column of the grid, copy and paste row or column data, etc. The Edit menu provides a variety of tools for modifying data in the grid. Excel users, for example, may copy a block of data from an Excel file and paste that block of data into the OpenStat grid. Occassionally a user will need to recode values in one of his or her variables. The recode option provides this capability. In some statistics programs, data which represents group membership may consist of strings such as "Male" or "Female". OpenStat requires group codes to be integer values. An option exists for creating integer codes from a variable containing string codes. If you are a user from a country that uses the comma (,) to separate decimal fractions rather than the period (.), you are going to be using the European standard for coding numbers. If you load a file using the USA standard (period separator) you may need to switch the coding to the European standard (comma separator.)
Under the Analyses main menu are listed a number of major sub-menues. Many of the descriptive and analyses procedures produce graphical output. As an example, the following is a plot of X versus Y from the Descriptives Menu:
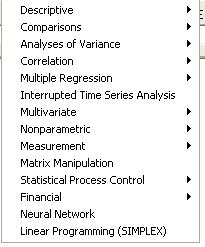
Clearly, there are too many procedures to describe here. OpenStat contains a large variety of parametric, nonparametric, multivariate, measurement, statistical process control, financial and other procedures. One can also simulate a variety of data for tests, theoretical distributions, multivariate data, etc.
This Web Page Created with PageBreeze Free HTML Editor